Here’s Where the Minnesota Vikings Offense Ranks through Week 11

At 8-2, the Minnesota Vikings have solidified themselves near the top of the NFC standings through 11 weeks of the regular season.
A big reason for that has been a much more balanced offensive attack, implementing a rushing attack like Kevin O’Connell has never done before during his head coaching stint. As we look ahead to Week 12, here is a look at where the Vikings offense currently ranks statistically.
Team Offense

Total Offense
- Points Scored per Game: 24.4 (10th)
- Total Yards per Game: 341.0 (15th)
- Plays per Game: 61.7 (18th)
- Yards per Play: 5.5 (14th)
- First Downs per Game: 20.6 (T-11th)
- Turnovers per Game: 1.7 (29th)
- Third Down Conversion Percentage: 39.7% (T-12th)
- Fourth Down Conversion Percentage: 66.7% (T-6th)
- Red Zone TD Percentage: 56.3% (14th)
- Overall PFF Grade: 77.3 (8th)
- EPA/play: 0.00 (13th)
The Vikings remain a top 10 scoring offense in the NFL, but that trend has been creeping back closer towards the middle of the pack in recent weeks. In fact, Minnesota’s 18.7 points per game over the past three weeks ranks 24th in the league.
Luckily, those low-scoring games have not resulted in a single loss over that three game stretch thanks to some outstanding play from the defense. The Vikings have a chance to get back on track against a porous Bears defese.
Passing Offense
- Completions per Game: 20.1 (T-17th)
- Pass Attempts per Game: 29.5 (25th)
- Passing Yards per Game: 224.6 (13th)
- Yards per Pass Attempt: 8.2 (6th)
- Passing TDs per Game: 1.9 (T-5th)
- Interceptions per Game: 1.0 (24th)
- Passing PFF Grade: 77.2 (8th)
- Pass Blocking PFF Grade: 73.8 (8th)
- Receiving PFF Grade: 78.0 (T-6th)
- EPA/pass: 0.09 (12th)
Rushing Offense
- Carries per Game: 29.3 (8th)
- Rushing Yards per Game: 116.4 (19th)
- Yards per Carry: 4.0 (26th)
- Rushing TDs per Game: 0.5 (30th)
- Fumbles Lost per Game: 0.7 (T-28th)
- Rushing PFF Grade: 68.9 (28th)
- Run Blocking PFF Grade: 70.2 (8th)
Minnesota’s rushing rankings took a pretty steep tumble this past weekend due to an inefficient day against the Tennessee Titans. However, it cannot be overstated how much of a difference a more consistent commitment to the running game has helped the Vikings this season.
With a matchup looming against a Chicago Bears defense that has not been a superb unit against the run this season, it should provide a nice bounce back opportunity for Jones and Co.
Individual Players

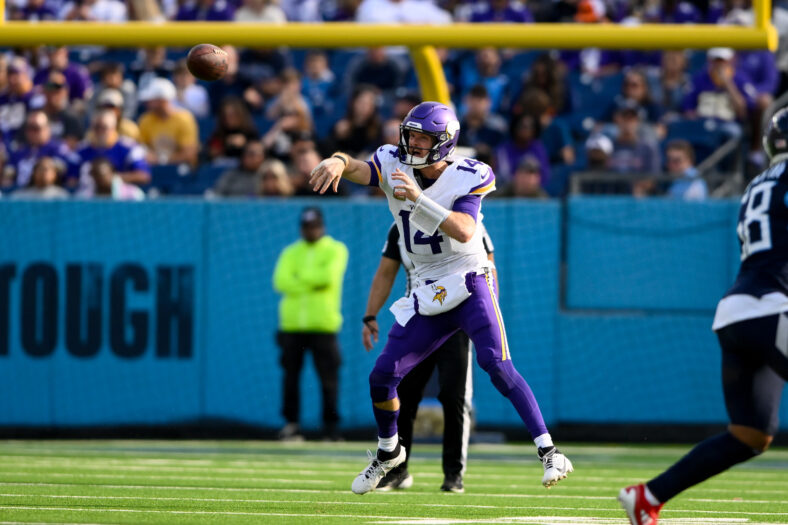
QB Sam Darnold
- Completions: 199 (16th)
- Pass Attempts: 293 (16th)
- Completion Percentage: 67.9% (11th)
- Passing Yards: 2387 (13th)
- Yards per Attempt: 8.1 (6th)
- Passing TDs: 19 (5th)
- Interceptions: 10 (4th-most)
- PFF Grade: 78.9 (12th among 29 QBs with min. 200 dropbacks)
RB Aaron Jones
- Carries: 157 (12th)
- Rushing Yards: 692 (14th)
- Yards per Carry: 4.4 (21st)
- Rushing TDs: 2 (T-45th)
- PFF Grade: 74.8 (18th among 35 RBs with min. 80 carries)
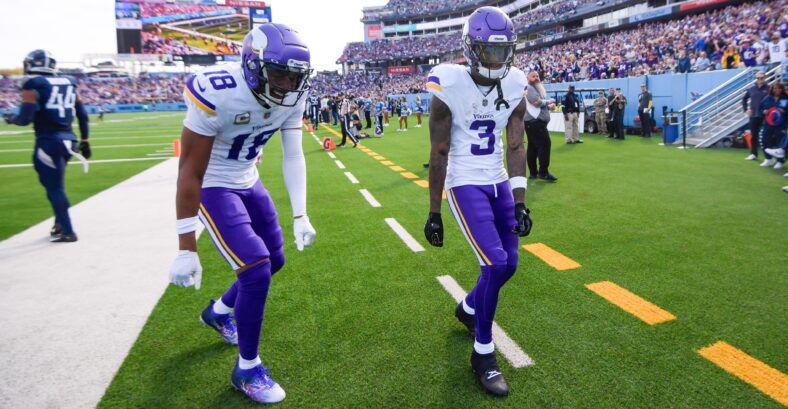
WR Justin Jefferson
- Targets: 86 (T-7th)
- Receptions: 59 (10th)
- Receiving Yards: 912 (2nd)
- Receiving TDs: 5 (9th)
- PFF Grade: 85.3 (8th among 77 WRs with min. 35 targets)

WR Jordan Addison
- Targets: 41 (T-92nd)
- Receptions: 24 (T-118th)
- Receiving Yards: 359 (T-80th)
- Receiving TDs: 3 (T-38th)
- PFF Grade: 65.1 (59th among 77 WRs with min. 35 targets)
TE Josh Oliver
- Targets: 22 (T-174th)
- Receptions: 19 (T-154th)
- Receiving Yards: T-139th)
- Receiving TDs: 3 (T-38th)
- PFF Grade: 74.3 (8th among 42 TEs with min. 20 targets)
Editor’s Note: Statistics for this article were found via Pro Football Focus, Pro Football Reference, and nfeloapp.com.

You must be logged in to post a comment.