Here’s Where the Minnesota Vikings Defense Ranks through Week 11

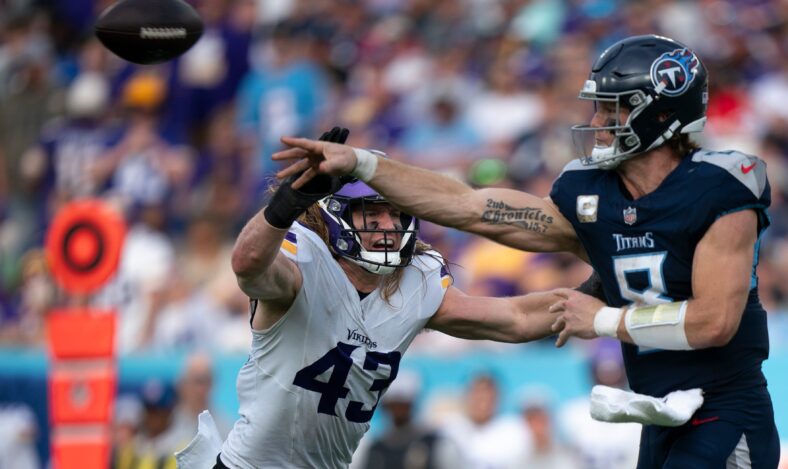
The Minnesota Vikings claimed their third straight win against the Tennessee Titans this past Sunday, improving their record to 8-2.
As a result, Minnesota continues to be cemented near the top of the NFC standings, and the main reason for that has been some superb play from their defense this season. As we head into Week 12, here is a look at where the Vikings defense ranks statistically.
Team Defense

Total Defense
- Points Allowed per Game: 17.0 (4th)
- Total Yards Allowed per Game: 309.2 (10th)
- Plays per Game: 61.2 (18th-most)
- Yards Allowed per Play: 5.1 (8th)
- First Downs Allowed per Game: 17.5 (T-4th)
- Takeaways per Game: 2.1 (1st)
- Third Down Conversion Percentage Allowed: 34.4% (7th)
- Fourth Down Conversion Percentage Allowed: 31.6% (1st)
- Red Zone TD Percentage Allowed: 60.9% (21st)
- Overall PFF Grade: 72.6 (11th)
- EPA/play: -0.17 (1st)
For a while this season, the Minnesota Vikings had their defense on the field more than nearly every other defense in the league in terms of plays per game. Now, though, this defense has not only kept teams from scoring, but they are forcing teams off the field earlier than they did during the opening stretches of the season.
Despite some turnover issues on offense too, the Vikings have nullified many of those problems by forcing more turnovers than any other team in the league. They are the only team in the NFL to average 2+ takeaways per game through 11 weeks.
Pass Defense
- Completions Allowed per Game: 23.3 (T-26th)
- Pass Attempts Against per Game: 36.9 (3rd-most)
- Completion Percentage Allowed per Game: 63.1% (8th)
- Passing Yards Allowed per Game: 234.8 (28th)
- Yards Allowed per Pass Attempt: 7.0 (14th)
- Passing First Downs Allowed per Game: 12.6 (29th)
- Passing TDs Allowed per Game: 1.5 (T-19th)
- Interceptions per Game: 1.6 (1st)
- Sacks per Game: 3.5 (2nd)
- Pass Rush PFF Grade: 62.9 (25th)
- Coverage PFF Grade: 63.8 (17th)
- EPA/pass: -0.06 (7th)
Run Defense
- Carries Against per Game: 20.8 (Fewest)
- Rushing Yards Allowed per Game: 74.4 (1st)
- Yards Allowed per Carry: 3.6 (3rd)
- Rushing First Downs Allowed per Game: 3.3 (1st)
- Rushing TDs Allowed per Game: 0.4 (2nd)
- Fumbles Recovered per Game: 0.5 (T-14th)
- Run Defense PFF Grade: 86.3 (1st)
- EPA/run: -0.32 (1st)
When your run defense can pile up top 3 rankings in just about every statistical category, you’re dealing with a unit that is historically great. Teams have been unable to crack the code in order to run the ball against Brian Flores’ group, and as a result, they’ve relied on the pass against the Vikings.
The Vikings have done a solid job of defending the pass as well, ranking eighth in completion percentage while racking up the second most sacks per game in the league. Minnesota’s defensive trenches have been fantastic this season, and they will need to continue that trend when January arrives.
Individual Players

OLB Andrew Van Ginkel
- Solo Tackles: 36 (T-81st)
- Tackles for Loss: 13 (1st)
- QB Pressures: 27 (T-54th)
- Sacks: 8.0 (T-5th)
- PFF Grade: 72.4 (28th among 83 OLBs with min. 250 snaps)
OLB Jonathan Greenard
- Solo Tackles: 23 (T-205th)
- Tackles for Loss: 9 (T-17th)
- QB Pressures: 51 (4th)
- Sacks: 7.0 (T-12th)
- PFF Grade: 83.9 (13th among 83 OLBs with min. 250 snaps)
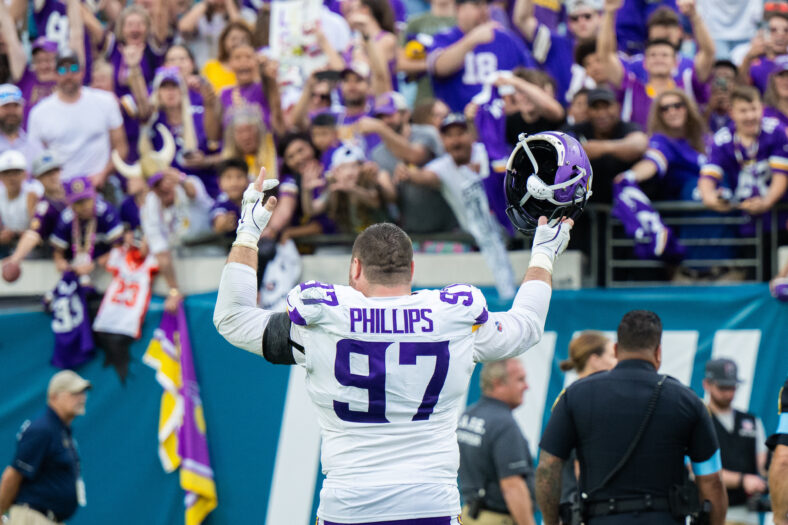
DT Harrison Phillips
- Solo Tackles: 11 (T-419th)
- Tackles for Loss: 2 (T-246th)
- QB Pressures: 11 (T-165th)
- Sacks: 2.0 (T-123rd)
- PFF Grade: 67.8 (27th among 87 DTs with min. 250 snaps)
DT Jonathan Bullard
- Solo Tackles: 10 (T-439th)
- Tackles for Loss: 5 (T-82nd)
- QB Pressures: 5 (T-282nd)
- Sacks: 0
- PFF Grade: 58.1 (50th among 87 DTs with min. 250 snaps)
DT Jerry Tillery
- Solo Tackles: 8 (T-504th)
- Tackles for Loss: 1 (T-362nd)
- QB Pressures: 11 (T-165th)
- Sacks: 0
- PFF Grade: 60.4 (T-44th among 87 DTs with min. 250 snaps)
LB Blake Cashman
- Solo Tackles: 25 (T-180th)
- Tackles for Loss: 5 (T-82nd)
- QB Pressures: 10 (T-177th)
- Sacks: 3.0 (T-75th)
- Passes Defended: 5 (T-59th)
- PFF Grade: 79.3 (5th among 59 LBs with min. 350 snaps)
LB Ivan Pace
- Solo Tackles: 31 (T-121st)
- Tackles for Loss: 6 (T-59th)
- QB Pressures: 15 (T-106th)
- Sacks: 3.0 (T-75th)
- PFF Grade: 63.6 (33rd among 59 LBs with min. 350 snaps)
CB Byron Murphy
- Solo Tackles: 37 (T-73rd)
- Tackles for Loss: 3 (T-165th)
- Passes Defended: 8 (T-14th)
- Interceptions: 4 (T-4th)
- PFF Grade: 70.5 (25th among 85 CBs with min. 350 snaps)
CB Stephon Gilmore
- Solo Tackles: 29 (T-141st)
- Tackles for Loss: 1 (T-362nd)
- Passes Defended: 5 (T-59th)
- Interceptions: 1 (T-48th)
- PFF Grade: 60.6 (57th among 85 CBs with min. 350 snaps)
S Camryn Bynum
- Solo Tackles: 29 (T-141st)
- Tackles for Loss: 0
- Passes Defended: 8 (T-14th)
- Interceptions: 3 (T-8th)
- PFF Grade: 65.0 (28th among 70 safeties with min. 350 snaps)
S Josh Metellus
- Solo Tackles: 33 (T-104th)
- Tackles for Loss: 2 (T-246th)
- Passes Defended: 3 (T-145th)
- Interceptions: 1 (T-48th)
- PFF Grade: 66.7 (23rd among 70 safeties with min. 350 snaps)
S Harrison Smith
- Solo Tackles: 32 (T-112th)
- Tackles for Loss: 2 (T-246th)
- Passes Defended: 7 (T-30th)
- Interceptions: 2 (T-19th)
- PFF Grade: 60.2 (45th among 70 safeties with min. 350 snaps)
Editor’s Note: Statistics for this article were found via Pro Football Focus, Pro Football Reference, and nfeloapp.com.

You must be logged in to post a comment.