Guest Post: Evaluating Adrian Peterson’s Likelihood of Decline, Part Three

[Note: As the Adrian Peterson saga drags on, now is a perfect time to continue the three-part study Brad Davis has put together on the likelihood of decline from Adrian Peterson. Previously, we looked at Adrian Peterson’s statistical output alone when determining whether or not he’s declining, but in Part Three, Brad Davis looked at 33 different running backs to see the commonalities in running back decline and how they apply to Adrian. Davis, who doesn’t take a stance on Peterson’s trade value in these pieces, ran through the data with rigorous statistical analysis. Part One of the study, which looks solely at Peterson’s career, is here. Part Two of the study, which answers criticisms and questions of part one, is here.]
by Brad Davis
Everybody who follows football beyond the casual observer ‘knows’ that running backs, ALL running backs, performance declines with age. And everybody makes reference to the fact that this decline begins around age 30. This fact was brought up again and again in the discussion of whether Adrian Peterson has shown significant decline in his performance or whether we should expect to see this decline shortly.
In the first two blog posts discussing whether Adrian Peterson has shown any evidence of decline in his play over the course of his career, we evaluated his performance using four different metrics: Yards per attempt, WPA, and two different success rate measures: DD (down and distance), and AFA over two different time scales: his entire career, and the three most recent years in his career. And we didn’t see any evidence of decline in his performance for any of those four metrics over either time scale.
However in the course of that analysis and over the course of some discussion on forums and twitter, we began to wonder if it would be possible to detect any evidence for the decline in the performance of any running back using these metrics? After all, if everyone knows that all running backs decline and our metric for measuring decline is any good, we should be able to detect it, right?
With that in mind, we set out to see if the data supports this widely held view, not using conjecture, not using our eyes, but using rigorous statistical analysis of running back performance data. This was a pretty major undertaking. We obtained running back performance data for 33 running backs who have more than 8 years of history playing in the NFL who started playing in 1998 or later. This list includes: Adrian Peterson, Ahmad Bradshaw, Ahman Green, Brandon Jacobs, Brian Westbrook, Cedric Benson, Chester Taylor, Clinton Portis, DeAngelo Williams, Deuce McAllister, Dominic Rhodes, Edgerrin James, Frank Gore, Fred Jackson, Fred Taylor, LaDainian Tomlinson, LaMont Jordan, Larry Johnson, Marshawn Lynch, Maurice Jones-Drew, Michael Turner, Mike Anderson, Pierre Thomas, Reggie Bush, Ricky Williams, Ron Dayne, Ronnie Brown, Rudi Johnson, Sammy Morris, Shaun Alexander, Steven Jackson, Thomas Jones, and Willis McGahee.
We used an even more comprehensive approach to determine if a running back has demonstrated a decrease in their performance over the course of their career than we did in the original analyses. We used the same four metrics of player performance as in the initial analyses as our dependent variable (YPA, WPA, DD, and AFA) and used three measures (Age, Season, Number of Touches) as our independent variables for YPA and WPA, but only Season for AFA and DD.
[Ed. note—we explained what those acronyms mean in previous sections, but as a refresher: YPA is yards per attempt, WPA is win probability added (explained eloquently here), DD stands for “down and distance”—shorthand for traditional success rate measures that reward the running back for getting 60% of the required yardage to convert a new set of downs on first down, 40% on second down and 100% on third or fourth down—AFA stands for “Advanced Football Analytics,” a website that has its own success rate calculation based on win probability added.
Those four measures are not independent by any means, but they produce different outputs. We figured that if decline could not be detected by yards per attempt, maybe it could be detected by success rate—if a running back is getting worse at third-and-inches style running, success rate would detect that while YPA may not if a team pulls that RB out of those plays. If he is getting worse at first-and-ten style running, then success rate may or may not detect that, but YPA surely would]
Additionally, we examined the data in two additional ways. In our analysis of Adrian Peterson’s running back performance, we examined his entire career and looking only at the most recent three years. But we wondered—what if a running back had their largest decline in performance mid-career? And what if that decline persisted (i.e. it’s not just a temporary blip). We might not see that with either of the analyses we’d already considered.
Towards that end, we added two additional ways of analyzing the data: the largest decline observed over any three year period plus the most statistically significant decline over any three year period. Now in some cases, those two measures are going to identify the same set of years, but they don’t have to be the same.
This approach really maximizes our opportunity to see if there has been any decline in player performance. The choice of three years was somewhat arbitrary, but it seemed like a good balance between competing alternatives: two years would potentially identify pairs of seasons where a running back had a career year followed by an average one even if they didn’t actually experience any real decline (generally referred to as regression to the mean, and incidentally, it’s also the explanation for the ‘Madden Curse).
On the other hand four years (or more) would decrease the sensitivity to find rapid declines in performance, and the point of this exercise is to maximize our sensitivity. All in all we performed over 1000 statistical comparisons examining running back performance producing 792 different measures of decline for the 33 running backs included. There are additional ways of analyzing the data, but I don’t think that anyone can say that this analysis is anything short of comprehensive.
In order to determine if a running back has shown a statistically significant decline for a given measure, the P value of the slope describing the change in their performance must be less than 5%. Under that those criteria, 69.69% of all running backs in our data set showed evidence of decline in performance in at least one measure of running back performance, and 60.6% shows decline in two or more measures of running back performance.
The running backs that don’t show any evidence of decline in performance include Ahmad Bradshaw, Cedric Benson, Deuce McAllister, Dominic Rhodes, Marshawn Lynch, Mike Anderson, Reggie Bush, Ron Dayne, and Sammy Morris. Take note that Adrian Peterson is not on this list any more – we have identified one measure that shows some evidence of decline.
Specifically with the new analyses there is some statistically significant evidence of decline in his AFA success rate over the three seasons showing the most statistically significant decline. But because this is Adrian Peterson, we’re going to dig into this result a little bit deeper and identify the three-year period where he shows a decline in his AFA performance so we can get a better understanding of exactly what’s happening here.
Interestingly, this three-year period starts from 2007 and extends to 2009.
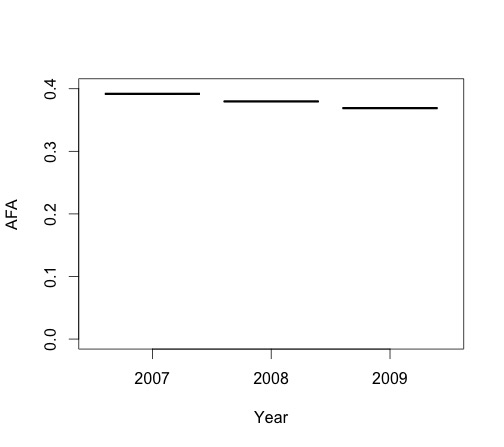
Looking at this figure alone, there seems to be strong evidence of a decline in his performance (P = 0.021) however this doesn’t place this short period of his career in a larger context, but we can do that quite easily (excluding his single game in 2014).
[Ed. note: remember, significance tests are supposed to tell us how likely it is that we should accept the “null hypothesis,” which means a lot of things that are relevant but the most important of which is that they will occasionally produce blips in data that are statistically significant, but not meaningfully so—as explained wonderfully by XCKD]
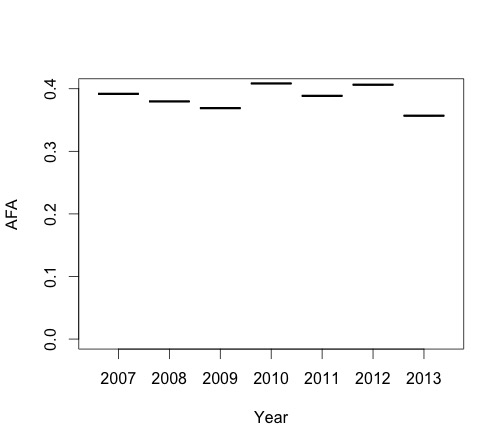
You can see from this figure that this decline just represents a short blip and his not indicative of an overall decline in the quality of his play. Consequently, I think we can make an argument that AP has not shown a decline in his play.
Now that also suggests that this metric looking at the largest (or most statistically significant) decline in performance over any three period may be overly sensitive and identifying early and unsustained declines in performance for other running backs to. So how does this affect our overall conclusions about the percentage of running backs that show a decline versus considering their entire careers or their last three years?
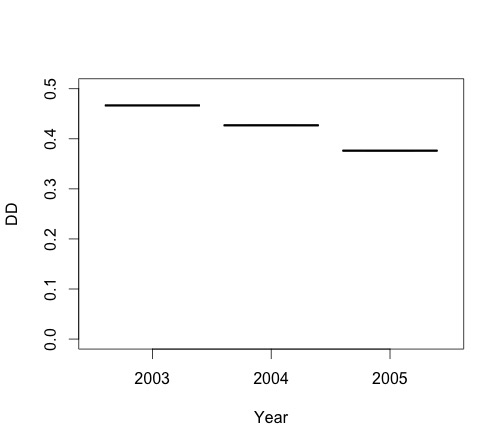
It turns out that it doesn’t affect things very much at all. It decreases the fraction of running backs showing a decline in play, but not drastically- it declines from 69% to 64% and includes: Adrian Peterson, Ahmad Bradshaw, Cedric Benson, Deuce McAllister, Dominic Rhodes, Fred Taylor, Marshawn Lynch, Mike Anderson, Pierre Thomas, Reggie Bush, Ricky Williams, Ron Dayne, Ronnie Brown, Rudi Johnson, Sammy Morris, Shaun Alexander, Steven Jackson. It turns out that there’s only one other player who shows evidence of decline in one of these extra sensitive decline detectors in addition to Adrian Peterson and that’s Fred Taylor. So let’s take a closer look at him too.
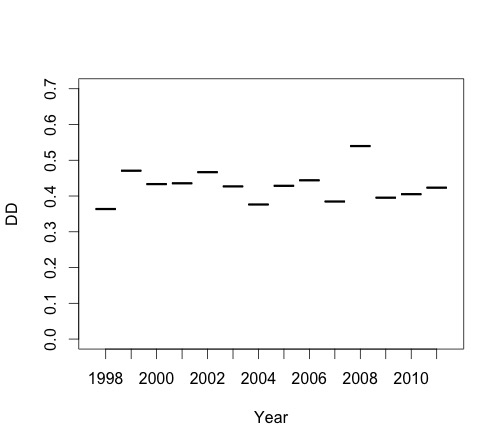
In this case, the most statistically significant decline was detected in the DD metric between 2003 to 2005, but looking at the bigger picture of his entire career you can see that there was no sustained decline and Fred Taylor played at a pretty consistent level through out his career.
So in summary, yes, we can detect declines in performance for a large fraction of NFL running backs (between 64 to 69%, depending on the metrics examined) over the course of their careers. And while this number represents a majority of the running backs included in our data set, it doesn’t represent an overwhelming majority of running backs.
It’s uncommon for running backs to show no decline in performance, but it’s not rare either. I think that’s an important point to highlight—it’s not a forgone conclusion that all running backs experience a decline in their play before they retire. That view is just not supported by the data.
Of course everybody ages, and as we get older our physical capabilities begin to diminish after some point. There are lots of other reasons why a running back may get cut from a team or retire other than a decline in their performance. Salaries for featured players increase the longer they are in the league. One of the most cited reasons for trading or cutting Adrian Peterson from the Viking’s is his cap hit: there are cheaper alternatives available. Players themselves may become wary of the toll the game is taking on their bodies, even if they’re still able to perform at a high level.
Furthermore, despite looking at these additional metrics we do not see any statistically significant and meaningful decline in performance for Adrian Peterson. This is spite of the fact that we can detect temporary (and not sustained) decline in performance early in his career. I think that Adrian Peterson can play at a high level for many more years.
You must be logged in to post a comment.