Guest Post: Evaluating Adrian Peterson’s Likelihood of Decline, Part Two

[Note: Brad Davis found methodological disagreements with an article written by the ever-productive CCNorseman at the Daily Norseman, which suggested that Adrian Peterson was in for a decline based on his career numbers. Davis, who doesn’t take a stance on Peterson’s trade value in these pieces, ran through the data with rigorous statistical analysis—here are the results to part two of his study, answering some criticism. Part Three, which looks at 33 other running backs, will be up later]
In the first part of this blog post, I attempted to address the question of whether there was any evidence for a decline in Adrian Peterson’s performance as a running back during his career in the NFL up until this point. A number of people on here and elsewhere on the internet brought up a number of questions and I am going to take this opportunity to try and respond to the one I found the most interesting.
A user on reddit questioned the use of all 7.0625 (7 full seasons + the first game of the 2014 season) in trying to determine if there has been any decline in Adrian Peterson’s play. Specifically they were concerned that by including all of the early seasons into the analysis could mask any recent declines in his performance. This brought up a good point underlying the bigger question of ‘Which data/games should be included in the analysis’?
At a first pass, one could do what I did and use all of the data. That certainly seems like a defensible thing to do. A priori, I had no expectation about if or how Adrian Peterson’s performance would degrade over time. After all, before looking at the data I wasn’t sure when (if any) decline may begin, so starting with his first professional game seemed like a reasonable starting point, and I maintain that it is.
But when we don’t find any evidence, perhaps we should look a bit more carefully at his later years when we have a higher expectation to observe a decline, if one exists. But even once we’ve accepted that it seems like a good thing to do, we still don’t know how many seasons / games should be included in the analysis.
One potential solution is to first do the analysis with all 7.065 seasons of play, and then go on to re-do the analysis for 6.065 seasons, and then 5.065 seasons, and so on, and so forth until we’re down to simply 2.065 seasons. In one sense, this provides us the maximum usage and benefit of our data. If a decline doesn’t start until two years ago, we won’t have the problem with earlier seasons masking it.
On the other hand, there is a pretty major conceptual flaw with this approach. It changes the nature of the question that we’ve been asking from “Is there any evidence that Adrian Peterson experienced a decline in the quality of his play?” to “Can we find a set of data that supports the hypothesis that Adrian Peterson has experienced a decline in the quality of his play”
One question asks a question in a scientifically/statistically fair way, the other presupposes the existence of a particular answer and then goes searching for that answer in the data.
This is related to a problem that in statistics we call the ‘multiple comparisons problem’, which basically says that if you look hard enough through a set of data, you’ll eventually find a statistically significant result, even if it doesn’t really exist.
With that in mind, there is a statistical solution to this ‘multiple comparisons’ problem that I just described, and basically what it does is reduce the level of the P value that we consider statistically significant from 0.05, to some much smaller number, depending on the number of comparisons made. There are many different ways of doing this including something called a ‘Bonferroni Correction’ or an approach that’s pretty popular in Bioinformatics called ‘False Discovery Rate’, but I’m not going to get into a discussion of those here.
As in the first part of the post, we used four different metrics to examine performance: Yards per carry, WPA, DD (a metric of run efficiency), and APA (a different metric of run efficiency).
Since we’re now doing 6 comparisons for each of these measures, I’m not going to post 24 different figures. Instead, I’m going to post 4 composite figures, each with six mini figures embedded within them (one for each analysis), and a table summarizing the figures with the associated slopes, P values and R2 values for ease of comparison.
Each of the mini figures is similar to the large figures included in the previous post. It shows each of the individual data points (i.e. the number of yards for a given carry, or the WPA score, etc) for each of the years included in the analysis, plus a trend line showing the overall change in the relationship over time.
And just a quick refresher on interpreting these values: a positive slope indicates that the performance metric is improving with time while a negative slope indicates that the performance metric is decreasing with time. A small P value implies that the observed relationship is statistically meaningful, while a large one (greater than 0.05) suggests it is not. A high R2 value (close to 1) means that the performance is very well predicted by the number of years, while a value close to zero indicates no predictive power.
Yards per carry
| Starting Year | Last Year | Slope | P value | R2 |
| 2007 | 2014 | 0.006688 | 0.943 | 0.0004555 |
| 2008 | 2014 | 0.09144 | 0.396 | 0.3955 |
| 2009 | 2014 | 0.1504 | 0.306 | 3.155e-05 |
| 2010 | 2014 | 0.06989 | 0.741682 | 0.0007228 |
| 2011 | 2014 | -0.1455 | 0.6996 | 0.0009454 |
| 2012 | 2014 | -1.3841 | 0.03780 | 0.004896 |
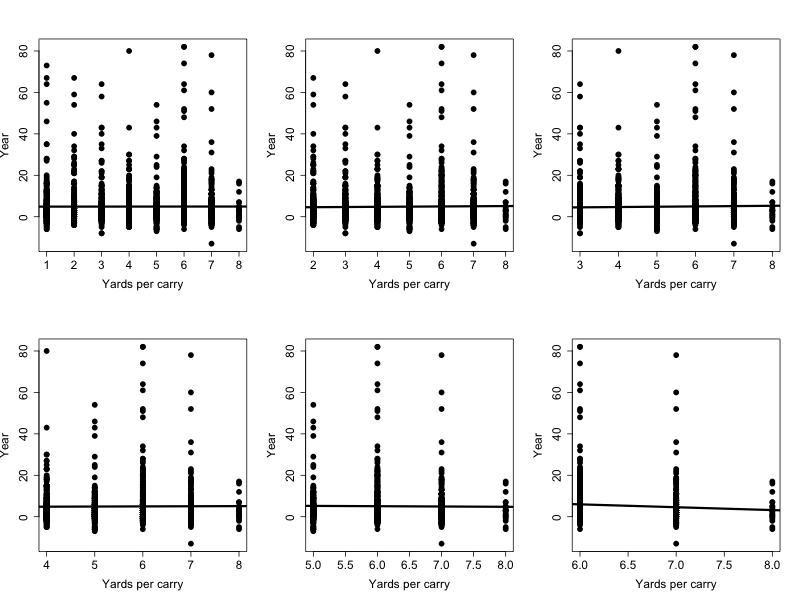
Looking at the Yards Per Carry, we can see that there is no evidence for any performance decrease when starting with year 2007 up to and including year 2010. The slopes for all of those sets of analyses are positive, but then starting in 2011 the slope changes directions and starts to become negative, and this trend remains when starting with the year 2012. At some level this suggests that Adrian Peterson may have started exhibiting a decline sometime after 2011, although we must remember that each of these analyses are not independent of each other. All of the data included in the 2011 data analysis is also included in the 2010 analysis, so as we change our starting year from 2007 through 2012 we’re placing greater and greater emphasis on more recent results.
Second, we need to look at the P-values associated with these slopes. As you’ll note all of the P values are much greater than 0.05, except for the analysis only including years 2012, 2013, and 2014 (the last line). In that case the unadjusted P-value is 0.03780, but we’ve put this data through the wringer, so to speak. We have punished the data trying to find some pattern, any pattern, and after 6 comparisons it has finally yielded.
That means the threshold for identifying the trend as statistically significant is no longer 0.05, but somewhat lower than that. After correcting for these multiple comparisons, the associated P value drops from 0.03780 to 0.22680, even using a relatively lax ‘False Discovery Rate’ multiple comparisons correction. In other words, not statistically significant. So while at first glance it appears that there may be evidence of a decline in #28’s performance after 2011, there really isn’t. Let’s move on to the next performance metric.
WPA
| Starting Year | Last Year | Slope | P value | R2 |
| 2007 | 2014 | 0.01478 | 0.248 | 0.0001537 |
| 2008 | 2014 | 0.02540 | 0.0878 | 0.0009874 |
| 2009 | 2014 | 0.03307 | 0.0984 | 0.001107 |
| 2010 | 2014 | -0.00110 | 0.9674 | 0.0008097 |
| 2011 | 2014 | -0.04463 | 0.348 | 0.0001318 |
| 2012 | 2014 | -0.08996 | 0.2842 | 0.0002197 |
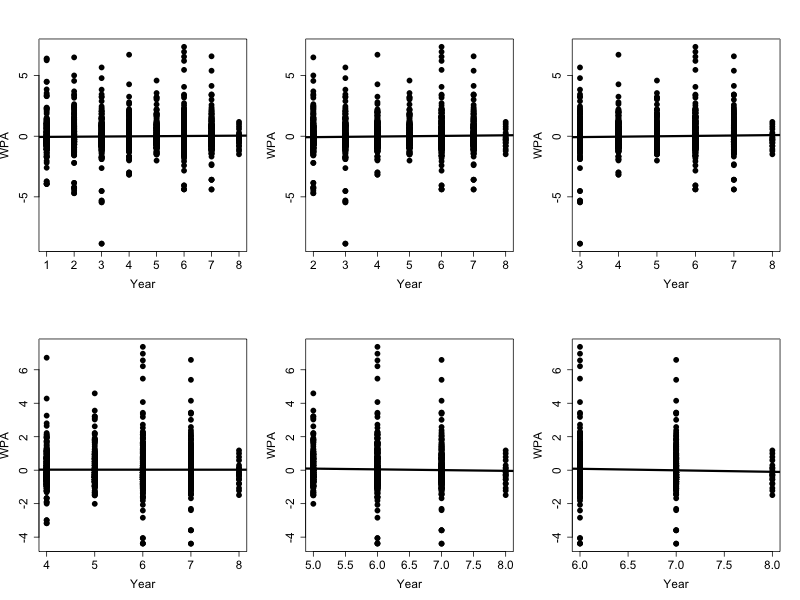
The story using the WPA metric is largely the same as using the YPA metric above, except that now there is even less evidence of a decline in performance than there was before. Yes, the slope is trending towards being negative after 2010, these analyses starting with the later years are more likely to be heavily influenced by one low year (i.e. 2011) than they were with the earlier data. Plus looking at the P value column from the associated table shows that none of the relationships are close to significant, meanwhile those with the most statistically meaningful P values are associated with overall improvements in performance.
Down-and-Distance
| Starting Year | Last Year | Slope | P value | R2 |
| 2007 | 2014 | 0.0003906 | 0.863 | 0.005409 |
| 2008 | 2014 | 0.00006861 | 0.982 | 0.0001136 |
| 2009 | 2014 | 0.0002798 | 0.948 | 0.001186 |
| 2010 | 2014 | 0.462655 | 0.391 | 0.2499 |
| 2011 | 2014 | -0.005363 | 0.56274 | 0.1912 |
| 2012 | 2014 | 0.486318 | 0.10187 | 0.9492 |
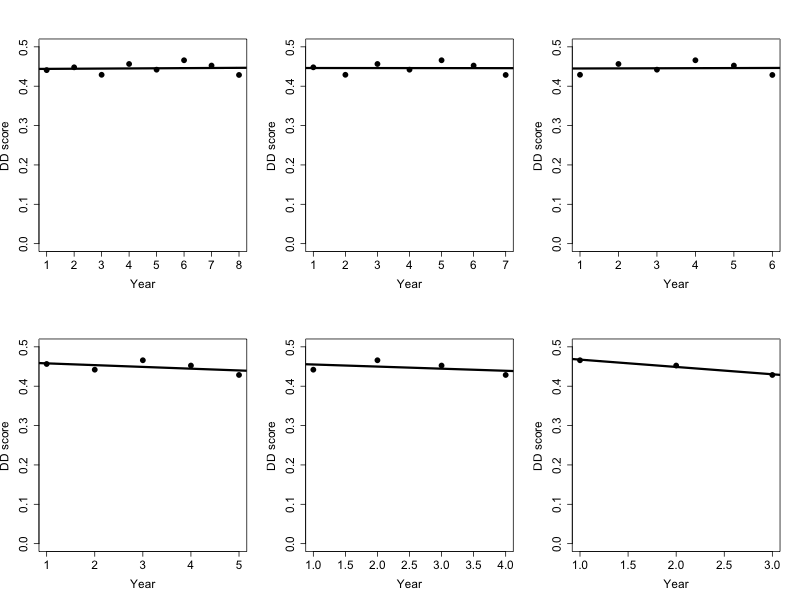
The DD metric shows a pattern somewhat intermediate between the YPA and WPA metrics. Again, there is no clear pattern showing a decrease in Adrian Peterson’s performance as we exclude more and more of his earlier years from the analysis. And as with the WPA analysis, the single year showing the greatest statistical weight (2012) shows a net improvement in his performance over those years.
AFA
| Starting Year | Last Year | Slope | P value | R2 |
| 2007 | 2014 | -0.004974 | 0.197 | 0.136 |
| 2008 | 2014 | -0.005616 | 0.274 | 0.078 |
| 2009 | 2014 | -0.007602 | 0.291 | 0.0867 |
| 2010 | 2014 | -0.01641 | 0.060 | 0.658 |
| 2011 | 2014 | 0.019126 | 0.175 | 0.521 |
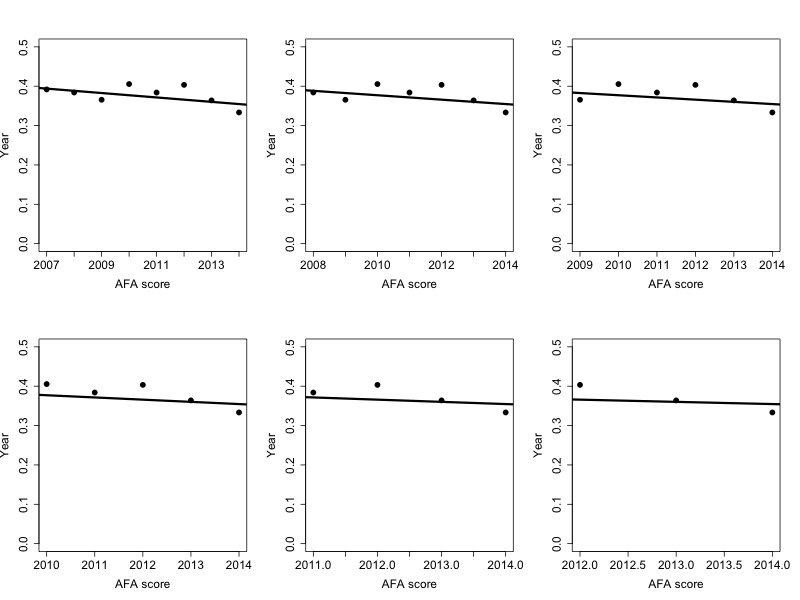
Finally we end up with the AFA metric, and just like all the other analyses that preceded it, there is no evidence whatsoever of any decline in Adrian Peterson’s performance. In this case the set of years that show the most support for a decline in performance (Years 2010-2014) looks like it might be close to statistically significant, but after we control for making multiple comparisons using the same data, that P value also becomes irrelevant.
As I was doing this analysis, I recognized that we had been analyzing the data looking for an overall decline through all of the seasons that where included in the analysis, when perhaps a more sensitive indicator would be to look to see if there was any evidence for a within year declines, and then look for strength of that decline to increase with each subsequent year.
To accomplish that, I again used a linear regression, but this time I performed the linear regressions within years across games. I then used the individual slopes from each of those single year regressions to see if I could detect a change in the within year slopes across seasons. And the answer to that is no. Adrian Peterson’s performance within years is remarkably consistent- there doesn’t seem to be a strong pattern of decline in performance at within years at all.
As I hope I’ve demonstrated, there doesn’t seem to be any real evidence for a decline in Adrian Peterson’s play as a running back. Yes, conventional wisdom says that when a running back hits 30, their play starts to decline and Adrian Peterson will hit 30 in the 2015 NFL season; but he hasn’t shown any evidence of decline yet. Surely the sands of time will catch up with him the way it will catch up with all of us, but when you’re as physically gifted as he is, perhaps that decline just takes a little bit longer than we’re used to.
In the next part of this post I’m going to look at the performances of 33 running back who have at least 8 seasons of data, and who played their first season after 1998 (when the database that we’re using has useful data) to see if we’re able to detect a decline in performance for any of them. Because after all, perhaps the reason we’re not seeing a decline in AP is because our method isn’t sensitive enough to detect a decline in any running back.
You must be logged in to post a comment.