Here’s Where the Minnesota Vikings Offense Ranks Through Week 6
A third of the way through the NFL season, we still don’t quite know exactly what this Minnesota Vikings offense is capable of.
They’ve suffered injuries up and down their offensive line, lost J.J. McCarthy for multiple games to an ankle sprain, and Jordan Addison has played just two games because of his suspension.
Alas, here is a look at where the Vikings offense ranks through six weeks.
Team Offense

Total Offense
- Points per Game: 24.6 (12th)
- Yards per Game: 305.0 (25th)
- Plays per Game: 57.2 (27th)
- Yards per Play: 5.3 (20th)
- First Downs per Game: 17.8 (25th)
- Turnovers per Game: 1.8 (30th)
- Third Down Conversion Percentage: 31.0% (30th)
- Fourth Down Conversion Percentage: 66.7% (T-11th)
- Red Zone TD Percentage: 66.7% (T-8th)
- Overall PFF Grade: 65.4 (25th)
- EPA/Play: -0.06 (27th)
It hasn’t been a smooth road for the Vikings on offense this year as the group finds itself in the mid-20s or lower for virtually every ranking other than points per game, fourth down conversion percentage, and red zone touchdown percentage.
Still, we have to keep in mind that this team has gone up against a couple defenses that have proven to be very good early in the year, and they spent two weeks in Europe. The Vikings do take on the Eagles this weekend, but perhaps being back at home and coming off a bye will be helpful.
Passing Offense
- Completions per Game: 19.2 (28th)
- Pass Attempts per Game: 29.2 (26th)
- Passing Yards per Game: 198.2 (T-19th)
- Net Yards per Pass Attempt: 5.9 (21st)
- Passing TDs per Game: 1.6 (T-19th)
- Interceptions per Game: 1.0 (T-27th)
- Passing PFF Grade: 63.0 (24th)
- Pass Blocking PFF Grade: 62.4 (12th)
- Receiving PFF Grade: 70.9 (12th)
- EPA/Pass: -0.05 (23rd)
Rushing Offense
- Carries per Game: 23.8 (27th)
- Rushing Yards per Game: 106.8 (21st)
- Yards per Carry: 4.5 (15th)
- Rushing TDs per Game: 0.8 (T-18th)
- Fumbles Lost per Game: 0.8 (26th)
- Rushing PFF Grade: 62.9 (29th)
- Run Blocking PFF Grade: 57.6 (20th)
- EPA/Run: -0.09 (25th)
There aren’t exactly a ton of things from the Vikings’ offensive numbers that stand out in a positive way, but part of that comes from the fact that they just have not had the ball to run a ton of plays. They rank 26th in pass attempts and 27th in carries. Once again, their rushing efficiency has been middle of the pack, but the Vikings have not been in a great position to utilize their running game all that much. We’ll see if that changes with the potential returns of Donovan Jackson and Brian O’Neill.
Individual Players
NOTE: Statistical rankings are made by position. For example, Justin Jefferson’s 29 receptions rank 14th among all wide receivers while T.J. Hockenson’s 19 receptions are tied for 20th among all tight ends.
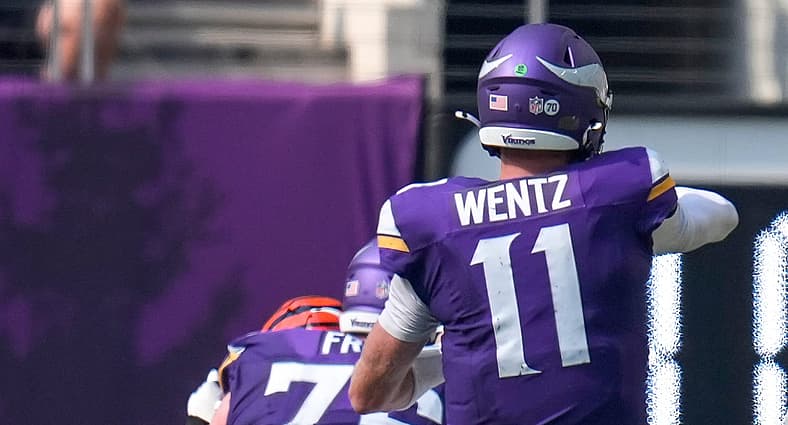
QB Carson Wentz
- Completions: 69 (30th)
- Pass Attempts: 100 (31st)
- Completion Percentage: 69% (10th)
- Passing Yards: 759 (31st)
- Yards per Attempt: 7.6 (10th)
- Passing TDs: 5 (27th)
- Interceptions: 2 (T-23rd-most)
- PFF Grade: 61.8 (28th among 33 QBs with min. 100 dropbacks)
RB Jordan Mason
- Carries: 69 (25th)
- Rushing Yards: 323 (23rd)
- Yards per Carry: 4.7 (16th)
- Rushing TDs: 3 (T-15th)
- PFF Grade: 68.6 (24th among 36 RBs with min. 50 carries)
WR Justin Jefferson
- Targets: 42 (T-16th)
- Receptions: 29 (T-14th)
- Receiving Yards: 449 (7th)
- Receiving TDs: 1 (T-46th)
- PFF Grade: 79.5 (12th among 69 WRs with min. 20 targets)
TE T.J. Hockenson
- Targets: 24 (T-20th)
- Receptions: 19 (T-20th)
- Receiving Yards: 153 (T-24th)
- Receiving TDs: 1 (T-21st)
Editor’s Note: Editor’s Note: Statistics for this article were found via Pro Football Focus, Pro Football Reference, and nfeloapp.com.
You must be logged in to post a comment.