Minnesota Vikings Statistical Rankings Through Week 5: Offense

The Minnesota Vikings are heading into their bye week as one of two undefeated teams in the NFl.
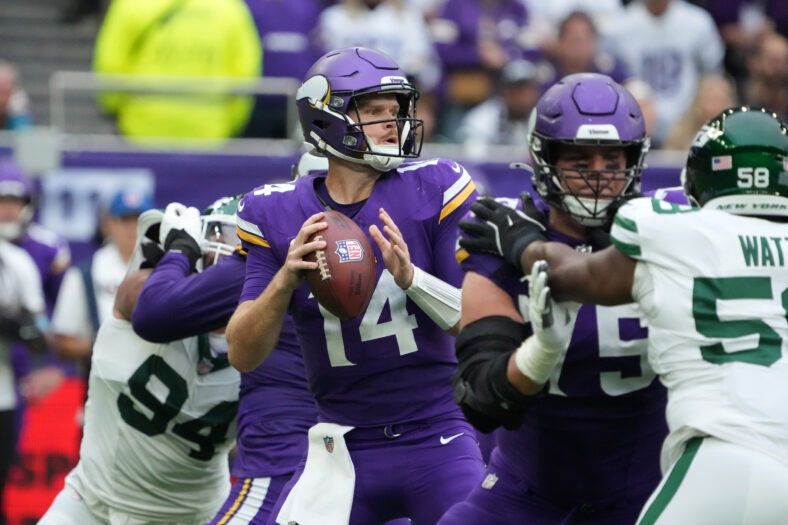
Much of the reason for their surprising success has been an unexpected surge on the offensive side of the ball with Sam Darnold at the quarterback position. Here is a look at where the Vikings stand statistically through Week 5.
Team Offense
Total Offense
- Points Scored per Game: 27.8 (6th)
- Total Yards per Game: 323.2 (18th)
- Plays per Game: 59 (T-23rd)
- Yards per Play: 5.5 (17th)
- First Downs per Game: 18.4 (T-20th)
- Turnovers per Game: 1.8 (30th)
- Penalties per Game: 7.4 (T-23rd)
- Third Down Conversion Percentage: 40.7% (T-13th)
- Fourth Down Conversion Percentage: 50% (T-16th)
- Red Zone TD Percentage: 68.8% (5th)
- Overall PFF Grade: 75.9 (9th)
- EPA/Play: -0.01
Minnesota’s offense certainly has cooled down over the past couple weeks after a red-hot start to the season, but Minnesota is still making the most of its opportunities. They remain a top-five offense in the red zone, which was an area that plagued them during the 2023 season.
Passing Offense
- Completions per Game: 17.6 (29th)
- Pass Attempts per Game: 27.6 (27th)
- Passing Yards per Game: 207.8 (18th)
- Yards per Pass Attempt: 8.2 (4th)
- Passing TDs per Game: 2.2 (T-2nd)
- Interceptions per Game: 0.8 (T-14th)
- Passing PFF Grade: 66.6 (15th)
- Pass-Blocking PFF Grade: 68.6 (15th)
- Receiving PFF Grade: 73.0 (T-10th)
- EPA/pass: 0.07 (13th)
Rushing Offense
- Carries per Game: 28.4 (12th)
- Rushing Yards per Game: 115.4 (17th)
- Yards per Carry: 4.1 (21st)
- Rushing TDs per Game: 0.6 (T-20th)
- Fumbles Lost per Game: 1.8 (T-31st)
- Rushing PFF Grade: 75.1 (18th)
- Run-Blocking PFF Grade: 78.0 (3rd)
If there are any qualms to have with the Vikings through the first five weeks of the season, two of them lie with the state of the offense: rushing efficiency and turnovers. The Vikings averaged less than three yards per carry in Week 5, which is not an outcome that will lead to many wins without the heroics of their defense. Meanwhile, they also turned the ball over twice, marking the fourth time in five weeks that the Vikings have had multiple turnovers in a game.
Minnesota is going to need to clean these things up if they want to remain in the conversation to make a deep playoff run, but if they do, this can be a very dangerous team.
Individual Players
QB Sam Darnold
- Completions: 87 (24th)
- Pass Attempts: 137 (19th)
- Completion Percentage: 63.5% (23rd)
- Passing Yards: 1111 (13th)
- Yards per Attempt: 8.1 (5th)
- Passing TDs: 11 (T-2nd)
- Interceptions: 4 (T-22nd)
- PFF Grade: 64.9 (21st among 35 QBs with min. 50 dropbacks)
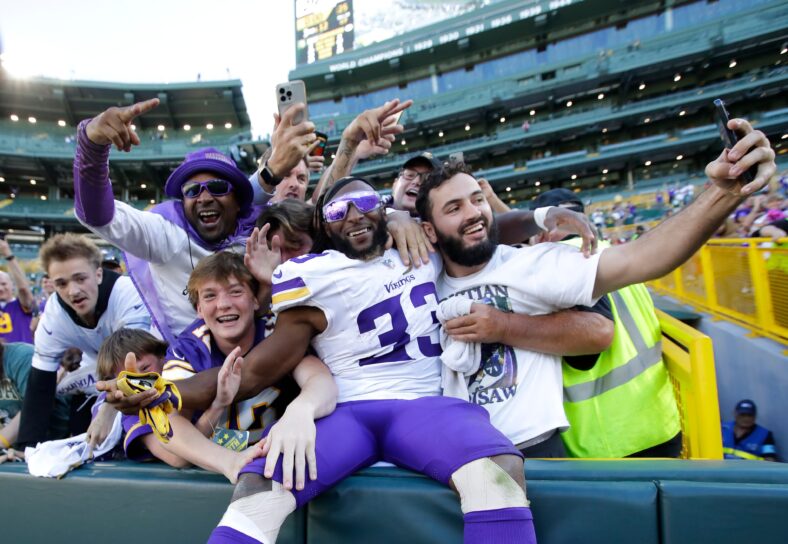
RB Aaron Jones
- Carries: 71 (13th)
- Rushing Yards: 350 (11th)
- Yards per Carry: 4.9 (16th)
- Rushing TDs: 1 (T-38th)
- PFF Grade: 85.4 (2nd among 35 RBS with min. 40 carries)
RB Ty Chandler
- Carries: 42 (T-36th)
- Rushing Yards: 147 (50th)
- Yards per Carry: 3.5 (44th)
- Rushing TDs: 0
- PFF Grade: 57.9 (34th among 35 RBs with min. 40 carries)
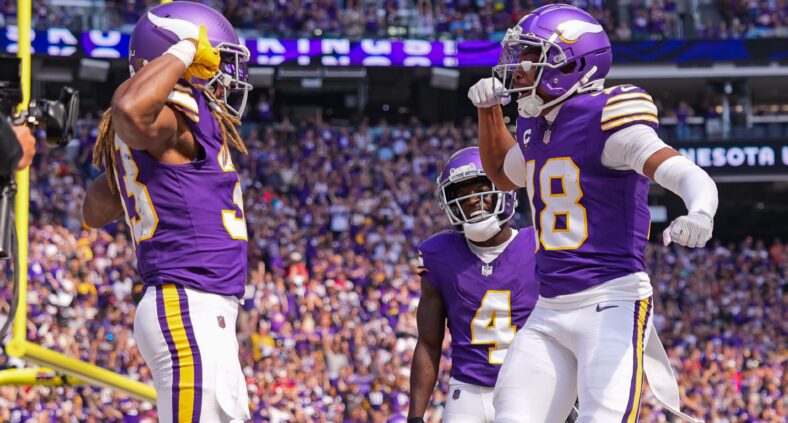
WR Justin Jefferson
- Targets: 43 (T-8th)
- Receptions: 26 (14th)
- Receiving Yards: 450 (3rd)
- Receiving TDs: 4 (T-3rd)
- PFF Grade: 81.4 (7th among 82 WRs with min. 15 targets)
WR Jordan Addison
- Targets: 16 (T-118th)
- Receptions: 9 (T-138th)
- Receiving Yards: 143 (97th)
- Receiving TDs: 1 (T-47th)
- PFF Grade: 68.5 (36th among 82 WRs with min. 15 targets)
Editor’s Note: Statistics for this article were found via Pro Football Focus, Pro Football Reference, and nfeloapp.com.
You must be logged in to post a comment.