GUEST POST: Evaluating Adrian Peterson’s Likelihood of Decline, Part One

[Note: Brad Davis found methodological disagreements with an article written by the ever-productive CCNorseman at the Daily Norseman, which suggested that Adrian Peterson was in for a decline based on his career numbers. Davis, who doesn’t take a stance on Peterson’s trade value in these pieces, ran through the data with rigorous statistical analysis—here are the results to part one of his study]
by Brad Davis
The 2014 NFL regular season is over, the post season is well underway and the Minnesota Vikings were eliminated from playoff contention back in week 16. Unfortunately that means that the only thing that Vikings fans have to look forward to is the Dallas Cowboys beating the Green Bay packers this week in Green Bay, free agency and the draft.
One of the most important issues for the Vikings to work out during this offseason is whether or not Adrian Peterson will suit up in Purple and Gold again. This is a pretty complicated problem that has a number of moving parts. Even if Adrian Peterson had played all 16 games for the Minnesota Vikings this past year, that would still serve as no guarantee that this wouldn’t be his last season as a Viking anyway.
The Vikings’ front office have to decide if they will keep him with his current contract, attempt to get him to restructure the deal to make it more affordable in terms of cap space going forward, trade him to another team, or cut him outright. Similarly, Adrian Peterson might well have wanted a change of scenery anyway. If he didn’t believe that the Vikings where going to be legitimate Super Bowl contenders in the next year or two, he might prefer to play on a team that is.
Now combining those realities with the fact that Adrian Peterson was placed on the Commissioner’s exempt list for the final fifteen games of the season and his apparent disappointment with the team for their poorly veiled attempts to keep him off the field and you have a situation that makes it seem more likely that Adrian Peterson has played his last game as a Viking.
Still, if these issues between Adrian Peterson and the Vikings could be worked out and he could be brought happily back into the Vikings organization, there is still the question of whether or not the Vikings even want him back. His contract has him as the highest paid running back in the league next year (and it’s not even close) and that uses a lot of money that might better be spent elsewhere.
Secondly, he will turn 30 years old during his next season, and traditional wisdom says that a running backs best days are before they turn 30. Now this year off means he’ll have one fewer year of carries on his body, so maybe that would buy him something, but how much? So with that in mind, people have started to assert that Adrian Peterson’s best days are behind him, and that he is already showing evidence of a decline in the quality of his play.
Thankfully though, we live in a world where we can answer these kinds of questions with data and statistics, instead of trying to rely ‘what we see with our eyes’, and ‘obvious truths’. In fact, the whole point of statistics is that it recognizes that we’re actually not very good at processing large amounts of data intuitively and coming to the correct conclusions. So with that in mind, I’ve used data collected from pro-football-reference to look for any evidence that his performance has already started to degrade.
To accomplish this goal, I’ve used a statistical tool called linear regression. Basically this tool allows me to check to see if there has been any change in Adrian Peterson’s performance over the number of years he has played on the NFL. Linear regressions are capable of generating a lot of numbers, but the three that we care the most about are the coefficient of determination (r2, which is the square of the correlation coefficient, r), the slope of the relationship between performance and number of years in the NFL (for example), and the P value associated with this slope.
A wee short bit of statistics 101 for you. An r2 of 1 means that we can perfectly explain Adrian Peterson’s observed performance by the number of years he has played on the NFL, while 0 means it provides no explanation. The slope describes the change in that relationship over time, with a positive value indicating that his play has improved over the years, a negative value indicating his play has declined, and a 0 indicating no change at all.
And then lastly the all important P value. This number tells us whether the aforementioned slope is actually different from zero. It is a bit counter intuitive, but the smaller the P-value is, the more likely that it is to be true. In generally we want a P value to be less than about 0.05 for us to have any real belief that the slope it’s associated with is meaningfully different from zero. With that statistical preamble out of the way, let’s start looking at some of the data.
Here we can see a figure showing the number of yards per carry across the first seven years of Adrian Peterson’s career. Each of the dots on the plot represents the number of yards for a given carry in every single game. The single flat line that running across the plot at approximately 5 yards (actually 4.870) represents the best fit line from the regression. As you will note, this line shows absolutely no decline through the 8 years that Adrian has played as a running back. If he was showing a decline in performance, that line would have a downward slope from the left to the right, but no slope is apparent. The r2 value is 0.0004555, and the slope (which is very slightly positive) is 0.006688. The p-value associated with the slope is 0.943, and as it turns out which means if anything Adrian Peterson’s yardage improved on a run by run basis over time, but not in a meaningful way. But at the very least, this data doesn’t show any evidence of a decline.
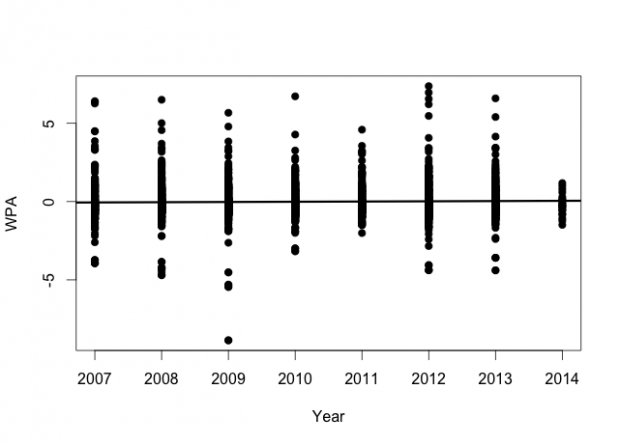
We can also look at another measure of running success, the WPA. The WPA can be thought of as the expected value (in terms of points that will be put on the board) as a result of a particular play. Values greater than zero mean that the play has helped increase the likelihood of putting points on the board, while negative values mean that a play has reduced the likelihood of scoring. So by it’s nature, we expect most of the values to be clustered slightly above zero.
This figure gives us essentially the same story as the previous one, except this time we’re using the WPA score instead of pure yardage. What’s interesting here is that, on average Adrian Peterson’s WPA score is very slightly negative (-0.07) but it’s not significantly different from zero (P = 0.226), but there isn’t any change in this value over time. It’s relatively stable. From this picture, one might guess that on most of his attempts Adrian Peterson doesn’t add very much to the score, if anything at all, but he has a relatively large number of plays where he adds a large number of points. Which is exactly what we see with Adrian Peterson when he runs. There’s a lot of fairly short runs, but those are punctuated by the occasional very long run. The horizontal line cutting across the figure again shows the best fit to the data, and as before, it doesn’t show any evidence of decline (r2 = 0.0001537, slope = 0.01478, P = 0.248) Again, the slope is positive, but not statistically significant. In short, this metric shows no evidence of decline.
There are two more different measurements of running back performance I want to look at before we close. They are two different measures of running back efficiency, both simple success-or-failure metrics.
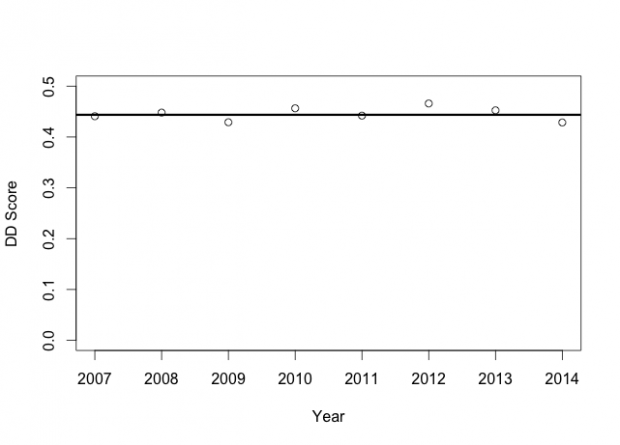
The first is the down-and-distance success rate, the more traditional success rate definition that counts all runs on first down that gain 40 percent or more of the required yardage to convert another first down as a success, as it does for runs of at least 60 percent of the required yardage on second down and 100 percent of the required yardage on third and fourth down. In this case we again see absolutely no evidence of any decline.
Here you can see that the down-and-distance measured success rate is fairly constant across the years. Again, there is no evidence of any decline whatsoever. As before, the horizontal line describes the best fit of the year to the observed data. It’s r2 is 0.005409, slope is 0.0003906, and associated P value is 0.863.
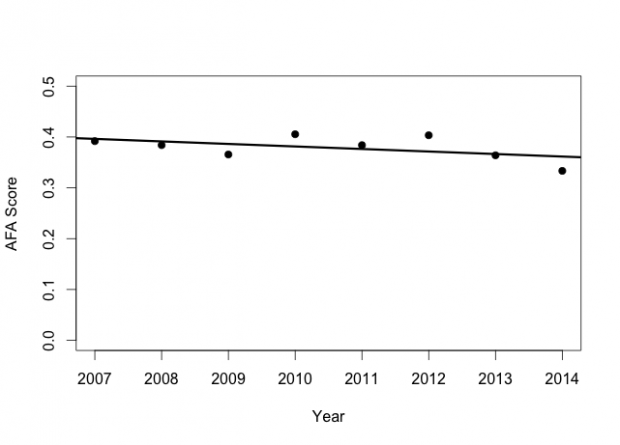
Through our first three measures of player performance, and we’re not seeing any evidence of any sort of decline at all. However, the story is a slightly different for the AFA efficiency metric, which measures success by whether or not Adrian’s runs increased the likelihood (based on historical data running back to 1999) that an average team in the same position was more or less likely to score points with the change in position.
Unlike all the other measures we’ve looked at to this point which have not shown any decrease in performance, this metric shows a small one. The R2 is 0.1363, slope is -0.0004974, and the associated P value is 0.197. So the trend is towards a slight decline in performance, but the P value says that at this point in time, we have no evidence that any decline exists yet, because 0.197 is well above the level of 0.05 (where we’d consider it to be meaningful).
So in short, after looking at four different metrics of running back success, we’ve seen that three out of the four show absolutely no evidence for any decline in performance, and in the fourth there is maybe a small hint at a decrease in performance, but our statistical tools are telling us that this is meaningless.
What should we take away from all of this? First and foremost, I think it’s fair to say that it’s way too early to say that Adrian Peterson has shown any decline in his ability at all, and he will likely be every bit as good next year as he was in previous years.
Further, I think it’s also important to point out that it wouldn’t be surprising for a player who is as important to a team as Adrian Peterson was to the Vikings showed some degree of decline in his performance over time even if he was every bit as physically capable as he was before.
Until Teddy Bridgewater came to town, our offense was one dimensional and extremely predictable. It was AP all the time. Teams would load the box with 8 defenders trying to stop him, and they would still fail. Over time, we would expect that teams would become slightly better at stopping him and pulling out all the stops to do so, because they didn’t have to worry about our passing attack. Yet in spite of fact that defensive coordinators are going to do their best to come up with schemes to slow their opponents’ offenses down, they were relatively unsuccessful at doing so to Adrian Peterson. It partially goes to show just what an amazing freak of nature Adrian Peterson is.


You must be logged in to post a comment.