2015 NFL Draft: The Final Consensus Big Board
I’ve gathered boards from 43 different rankers (Kiper was a late addition), 13 of them “Big Draft” media types and the other 30 as amateur evaluators. I’ve also updated the big boards from CBS, Matt Miller and NFL.com as well as a few others, but for the most part rankings haven’t changed since the last time I’ve posted them.
To go over the process again, you can click here. It describes how the board is built, and how we come up with the different categories, like “most polarizing player,” “biggest disagreements” and so on. As a quick summary, we’ve separated the rankings into two big boards: “forecasters” and “evaluators.”
Forecasters are primarily in the business of predicting how the draft will go (or, more accurately, their big boards tend to do that) in large part because of their access to information the NFL has, which can be good and bad—critical information like the nature of off-field issues and injuries are incorporated, but so are the lies teams feed the media.
Evaluators rely more on the data they can acquire from game tape (when available), the broadcast angle of games and publicly available quantitative information, like combine measureables and statistics. Many will rely on media reports, but recognize the limitations of that when applying injury or character information.
Biggest Disagreements
Last year, when forecasters disagreed with evaluators, the forecasters batted nearly 1.000 on figuring out who was going to be picked higher. Looking at these disagreements may also reveal information teams have revealed to forecasters, but has not leaked to media at-large, or it may incorporate biases from specific team evaluations, like prioritizing certain builds or traditional evaluation models.
| Rank | Player | Eval | Forecast | Difference Score |
|---|---|---|---|---|
| 162 | Sean Mannion | 187 | 115 | 1.69 |
| 15 | La’el Collins | 13 | 27 | 1.62 |
| 180 | JaCorey Shepherd | 203 | 128 | 1.59 |
| 138 | Mitch Morse | 169 | 106 | 1.50 |
| 49 | Eric Rowe | 42 | 72 | 1.40 |
| 34 | Breshad Perriman | 40 | 22 | 1.33 |
| 78 | Donovan Smith | 89 | 54 | 1.32 |
| 13 | Trae Waynes | 16 | 8 | 1.20 |
| 129 | Shaquille Mason | 121 | 181 | 1.17 |
| 188 | Kyle Emanuel | 205 | 142 | 1.04 |
| 17 | Marcus Peters | 14 | 25 | 1.04 |
La’el Collins shows up there before being called in to cooperate with the Baton Rouge police, though I think most people would drop him pretty uniformly.
Some character players show up, as do players with divergent skillsets (Breshad Perriman is really good at some things and bad at other things for example) and Sean Mannion, of course.
This sort of stuff is endlessly fascinating to me, and hopefully we’ll figure out some long-run inefficiencies from this.
Biggest Agreements
Not a particularly interesting set of things to look at, but it’s kind of cool when we see players evaluated the same way by forecasters as they are evaluators. It may mean a clean or well-known character and the dominance of obvious traits on film.
| Rank | Player | Eval | Forecast | Difference Score |
|---|---|---|---|---|
| 194 | Bryce Hager | 194 | 191 | 0.00 |
| 179 | Durell Eskridge | 179 | 179 | 0.00 |
| 79 | Rashad Greene | 80 | 80 | 0.00 |
| 67 | T.J. Yeldon | 68 | 68 | 0.00 |
| 52 | Laken Tomlinson | 51 | 51 | 0.00 |
| 39 | Dorial Green-Beckham | 39 | 39 | 0.00 |
| 18 | Malcom Brown | 18 | 18 | 0.00 |
| 9 | Todd Gurley | 9 | 9 | 0.00 |
| 5 | Kevin White (WR) | 5 | 5 | 0.00 |
| 2 | Jameis Winston | 2 | 2 | 0.00 |
| 1 | Leonard Williams | 1 | 1 | 0.00 |
I’m not really sure why Dorial Green-Beckham is there. The two megaboards generally agree on where he should be placed, but the individual boards (as you’ll see below) vary wildly.
Most Polarizing Players
These players drew the biggest disagreements, relative to their draft position, among the 43 big boards.
| Rank | Player | School | Polar Score |
|---|---|---|---|
| 9 | Todd Gurley | Georgia | 7.3 |
| 39 | Dorial Green-Beckham | Missouri | 4.2 |
| 2 | Jameis Winston | Florida St | 3.8 |
| 172 | DeAndre Smelter | Georgia Tech | 3.0 |
| 12 | Randy Gregory | Nebraska | 3.0 |
| 49 | Eric Rowe | Utah | 2.8 |
| 166 | Frank Clark | Michigan | 2.3 |
| 198 | Ellis McCarthy | UCLA | 2.3 |
| 14 | Danny Shelton | Washington | 2.2 |
| 19 | Shane Ray | Missouri | 2.0 |
| 4 | Marcus Mariota | Oregon | 2.0 |
| 26 | Eddie Goldman | Florida St | 2.0 |
| 34 | Breshad Perriman | Central Florida | 2.0 |
| 7 | Vic Beasley | Clemson | 1.8 |
| 20 | Andrus Peat | Stanford | 1.8 |
| 54 | Cedric Ogbuehi | Texas A&M | 1.8 |
| 66 | Damarious Randall | Arizona State | 1.7 |
| 30 | Shaq Thompson | Washington | 1.7 |
| 71 | Ty Sambrailo | Colorado St | 1.7 |
| 83 | Tre’ Jackson | Florida St | 1.7 |
| 22 | Arik Armstead | Oregon | 1.7 |
| 68 | Mario Edwards Jr. | Florida St | 1.6 |
| 78 | Donovan Smith | Penn St | 1.6 |
Injury, character and inconsistent play dominate this board. There are also a fair amount of “raw” players and system concerns. Also, Vic Beasley, I guess.
Least Polarizing Players
These players were astoundingly consistent across all the individual boards, even at odd places like rank 134 or what have you.
| Rank | Player | School | Polar Score |
|---|---|---|---|
| 193 | Bryce Hager | Baylor | 0.2 |
| 162 | Mike Hull | Penn State | 0.2 |
| 190 | Wes Saxton | South Alabama | 0.2 |
| 171 | Blake Bell | Oklahoma | 0.3 |
| 138 | Christian Covington | Rice | 0.3 |
| 148 | Jake Ryan | Michigan | 0.3 |
| 197 | Ladarius Gunter | Miami FL | 0.3 |
| 154 | Vince Mayle | Washington State | 0.3 |
| 194 | Derrick Lott | Chattanooga | 0.3 |
| 200 | Jalston Fowler | Alabama | 0.3 |
| 132 | Jamil Douglas | Arizona St | 0.3 |
| 50 | Devin Smith | Ohio State | 0.3 |
| 192 | Xavier Williams | Northern Iowa | 0.3 |
| 186 | Karlos Williams | Florida St | 0.3 |
| 73 | Tyler Lockett | Kansas St | 0.4 |
| 189 | Malcolm Brown | Texas | 0.4 |
| 143 | Antwan Goodley | Baylor | 0.4 |
| 133 | Kurtis Drummond | Michigan St | 0.4 |
| 164 | Dezmin Lewis | Central Arkansas | 0.4 |
| 174 | Matt Jones | Florida | 0.4 |
| 167 | Quandre Diggs | Texas | 0.4 |
| 57 | Ameer Abdullah | Nebraska | 0.4 |
| 69 | Clive Walford | Miami (FL) | 0.4 |
| 79 | Rashad Greene | Florida St | 0.4 |
| 173 | Sean Hickey | Syracuse | 0.4 |
| 146 | Kenny Bell | Nebraska | 0.4 |
| 118 | Tony Lippett | Michigan State | 0.4 |
| 163 | Lorenzo Doss | Tulane | 0.4 |
| 160 | Taiwan Jones | Michigan State | 0.4 |
| 176 | Titus Davis | Central Michigan | 0.4 |
| 114 | Jamison Crowder | Duke | 0.4 |
| 144 | Josh Harper | Fresno State | 0.4 |
| 178 | Durell Eskridge | Syracuse | 0.4 |
| 62 | Nate Orchard | Utah | 0.4 |
| 177 | Darren Waller | Georgia Tech | 0.4 |
The Board
We have the board below, but first a fantastic probabilistic model based on the boards for determining the likelihood that a player survives to a particular pick. This was sent to me by @combinePhysics who used the boards to (to the best of my abilities, this is my guess) look at aggregate rank and distribution of ranks for each player to see how likely it would be that they’d be at a particular spot.
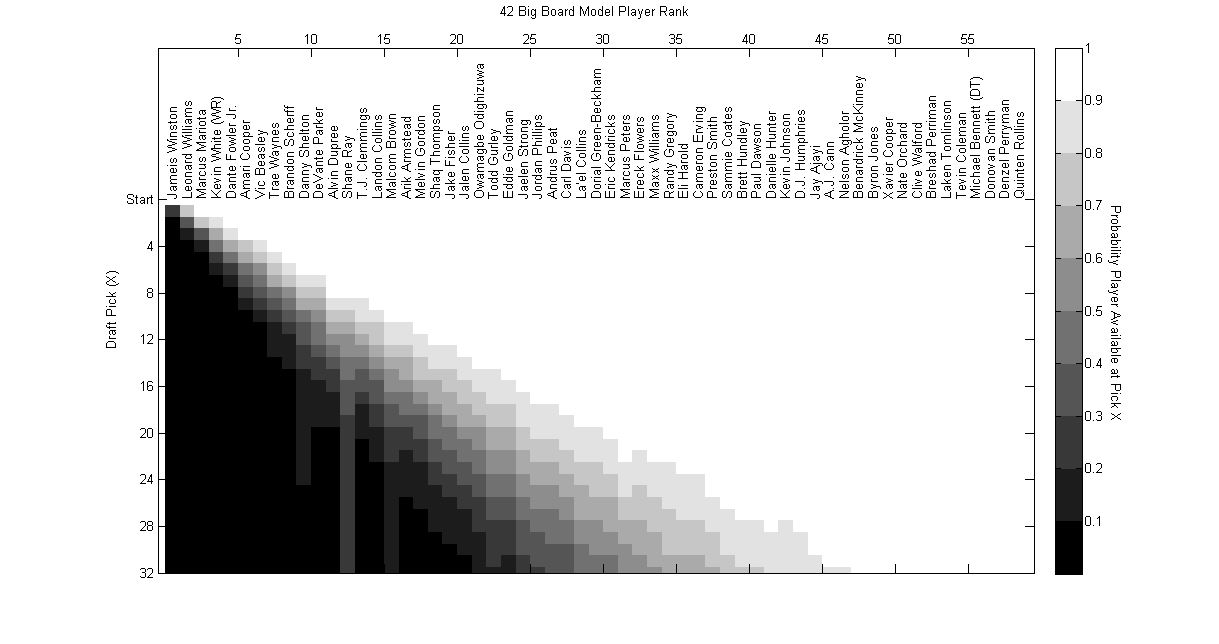
It did a great job last year, so it should be fun to track this year.
Below, we have players sorted by overall rank, but you can also see the most likely “role” they’ll play, like 5-technique, flanker, etc. and the position they’ll likely play, like wide receiver. So if you wanted to see the slot receivers compared against each other, you can click on the “SWR” tab at the bottom, or if you just want to see how all receivers compare to each other, the “WR” tab. As a review:

Alternate Boards
There are alternate boards, too.
Here’s the board for when you simply average all the ranks.
Here’s the relatively flawed board when you simply take the median of all the ranks.
This is what happens when you combine the two above approaches, and simply take the average rank for players when excluding ranks in the top and bottom quartiles. It gets rid of outliers while preserving the idea of averaging ranks instead of my normal method, which gives more of a bonus for a high rank than a penalty for a low on.
Here’s what happens when you weight forecasters and evaluators equally, instead of weighting each individual set of ranks equally.
UPDATE: As Cshedahi points out in the comments below, I didn’t include links to the final forecaster and evaluator boards! Big mistake, as those are pretty interesting. Embedded below. First, the evaluator board:
Next the forecaster board:
You must be logged in to post a comment.