2014 NFL Draft: Quarterback Passing Charts and Data for Teddy Bridgewater, Johnny Manziel, Blake Bortles and Derek Carr
Through 27 games, I was able to track the passing of the “Big Four” quarterbacks: Teddy Bridgewater, Johnny Manziel, Blake Bortles and Derek Carr—the presumed top four quarterbacks that have a reasonable chance of going in the first round.
Games tracked for Bridgewater: Ohio, Eastern Kentucky, Kentucky, Rutgers, South Florida, Houston, Miami (Bowl)
Games tracked for Manziel: Alabama, Arkansas, Missouri, Louisiana State, Auburn, Vanderbilt, Ole Miss
Games tracked for Bortles: Akron, Penn State, South Carolina, Louisville, Connecticut and Baylor (Bowl)
Games tracked for Carr: Rutgers, Boise State, Cal Poly, San Diego State, Utah State, San Jose State, Southern California (Bowl)
For this game tracking, I chose not to look at completion percentage, “true touchdowns,” or “true interceptions” but simply an evaluation of the ball placement. If the quarterback reasonably puts the ball in place for the receiver to get it, regardless of the actual catch, it’s counted as an accurate throw.
This will mean there are no penalties for drops, but there are penalties for spectacular catches where the receiver bails out the quarterback for poor ball placement. It also penalizes all dropped interceptions and touchdowns, while eliminating throws that could not reasonably be blamed on the quarterback in those situations.
Any drive resulting in a touchdown did not get any additional touchdown credit, even if a receiver dropped the ball in the end zone earlier in the drive. All distances are “true” insofar as they are recorded where the ball was thrown, not the final yardage gained on the play, which also means all throws in the end zone have additional yards tacked on based on where in the end zone the ball was thrown (a throw from the 15-yard line eight yards into the end zone would be recorded as a 23-yard pass).
Only passes that were “aimed” were included, which means no throwaways or receiver/quarterback miscommunications. A few penalties that made it impossible to determine ball placement were excluded as well (usually egregious holding).
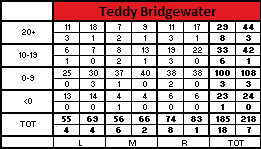
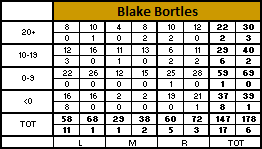
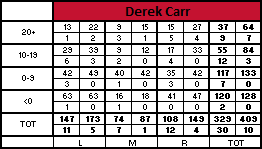
Each box of four includes “completions,” aimed passes, “true touchdowns,” and “true interceptions” based on ball placement as indicated:
![]()
There are a number of ways to track the data, all of which provide different contexts. I’ll attempt to walk through a few of them and see if there are any useful conclusions to draw.
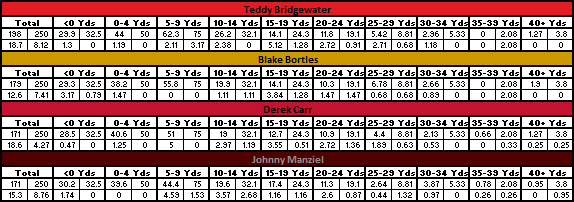
The first way to evaluate the data is to look at a simple spread of the throws by a two-dimensional look at a field:

That can be useful, but is a little hard to read, so breaking it up by individual quarterback can help as well:

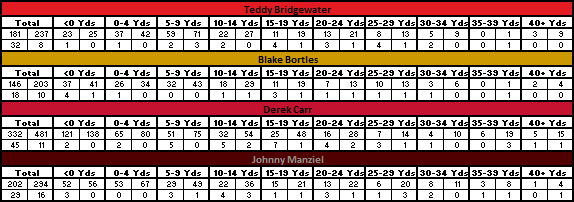
It might also be useful to granularize the depth of the throws, so a one-dimensional chart only looking at distance of throws (in 5-yard bins) will help, too:
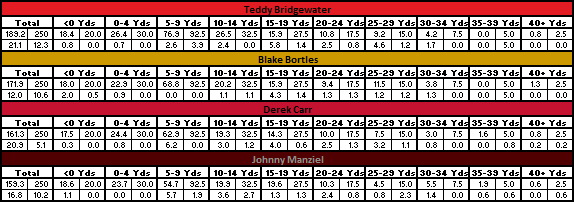
While all of those charts can be useful, it’s difficult to wrap one’s head around the different numbers, especially given the different nature of the offenses. One can even out the attempts (say, 250) and match it to the distribution of passes from 2012-2013 in the NFL, to project to a generic pro-style offense:
This is a little easier to look at and figure out. In a traditional passing distribution, Bridgewater is quite a ways ahead of the other quarterbacks, and Carr’s gaudy passing totals (he passed twice as often as others in the same amount of games) are adjusted to numbers that make more sense relative to each other. Here, Bortles’ high accuracy is ameliorated by the low touchdown total and average interception total, and Carr’s obscenely low interception rate can be put into context.
Both Carr and Manziel had their accuracy rating reduced from their original totals because the high number of screen passes and passes below 4 yards of depth were washed out, while Bortles’ passing distribution helps him.
You can use this to project passer rating and the even better metrics yards per attempt and adjusted yards per attempt onto the quarterbacks.
Bridgewater: 112.8 passer rating, 8.8 yards per attempt, 8.7 adjusted yards per attempt
Bortles: 90.3 passer rating, 8.0 yards per attempt, 7.6 adjusted yards per attempt
Carr: 106.6 passer rating, 7.6 yards per attempt, 8.3 adjusted yards per attempt
Manziel: 93.8 passer rating, 7.5 yards per attempt, 7.1 adjusted yards per attempt
You can also project it onto the Air Coryell offenses the NFL saw in the last two years:
Not much changes, given that the heavier emphasis on deeper passing hurts all of the quarterbacks, and the small difference between “traditional” pro-style and the Coryell style of offense means there aren’t dramatic changes. In that “system,” the numbers project as follows:
Bridgewater: 113.2 passer rating, 9.0 yards per attempt, 8.9 adjusted yards per attempt
Bortles: 97.7 passer rating, 8.2 yards per attempt, 7.8 adjusted yards per attempt
Carr: 106.9 passer rating, 7.8 yards per attempt, 8.5 adjusted yards per attempt
Manziel: 95.0 passer rating, 7.7 yards per attempt, 7.4 adjusted yards per attempt
Naturally, one of the biggest issues with all of this data is that there’s too much information to filter and it’s fairly difficult to process. There are easier ways to represent some of the data. The first of which is to reduce them to the three simple rate stats described above, but there are other ways to look at it, too. One can look at differential completion percentage by two-dimensional distance:
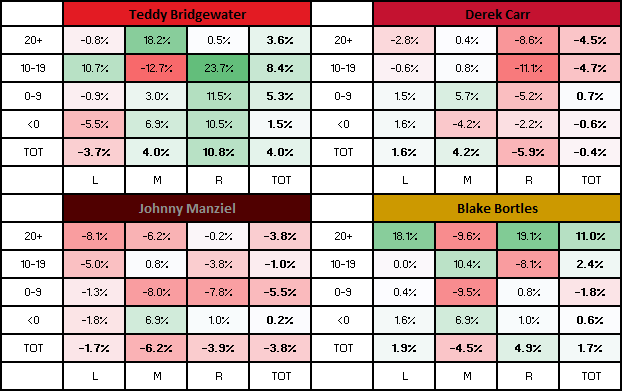
Or, one can look at one dimension distance:

The distance chart is not very useful, however, as it’s subject to highly random spikes given small sample sets at the far distances (Manziel between 30-34, Bridgewater and Bortles between 35-39, etc.), but it can still provide a small amount of context.
The most important thing is not to read too much into the data. Naturally, any rate statistics for the quarterbacks can be subject to the strength of opposing defenses, the skill of his receivers to get open and demand targets, the nature of the offense they were playing in (both Manziel and Carr play in spread variants that emphasize yards-after-the-catch and a short passing game, which is why their completion rates are low across the board despite highly effective offenses), etc.
But it does provide some context for the claims we make about quarterbacks. It doesn’t mean many of these claims are wrong but that they’re subject to a lot more explanation when they disagree with relevant data. For example, Bortles has a reputation for being a generally inaccurate thrower compared to the other Big Four quarterbacks—but has a better accuracy rating than two of the other ones.
It is not necessarily that the reputation is inaccurate; the UCF quarterback could have been working with larger windows or produced accurate passes in unsustainable ways (e.g. placed behind the receiver or after unnecessary extra adjustment). In this specific case, I do think that Bortles has underrated accuracy, but that there is something to be said about those other explanations for his reputation. Merely hitting one’s receiver is not enough.
The data can also be used to ask questions that reveal something about the quarterbacks’ games. Carr already had a low interception rate before game tracking (1.2%, 5th-best among all college QBs with 300 passes, below Marcus Mariota, Teddy Bridgewater, Cody Fajardo and Bryce Petty), but that could have been easily explained by the high percentage of screen passes in his game.
It doesn’t seem that simple, however, after adjusting all of his attempts for distance, where he massively outperforms his contemporaries in the same system. For Carr, it’s difficult to explain this away due to variance; he threw twice as many passes at intermediate distances than the other quarterbacks despite his system simply because he passed more. A different explanation could posit that Carr plays a little too safe, although that feels odd considering his willingness to audible and throw deep.
It’s true in a sense, however. Carr doesn’t necessarily avoid risky throws when the play calls for it, but he is particularly sure to place the ball in exclusive place for the receiver, where a defender can’t get to it. Sometimes, he’s a bit too attentive to this and it’s difficult for the receiver to get there as well and that’s a problem at times.
Another explanation is that because the defense is a bit too keyed in to the screen game, they aren’t necessarily in a position to punish him for lazy ball placement. The second explanation is a little true, but largely unfounded. For the most part, his low interception rate has to do with his tendency to keep the ball away from contested catches, which is why his deep misses are almost always overthrows.
Regardless, the data can be immensely useful so long as it isn’t used to replace judgment. The fact that distance adjusted passer rating is possible doesn’t mean that it is an effective way to rank the quarterbacks, but the data can allow us to test our assumptions, or force us to explain in detail why they still may be true. It can also lead to new questions which reveal something new about the prospects as well.
You must be logged in to post a comment.